When running benchmarks in Interval-Based-Reclamation, I observed a suspicious Voluntary Context Switches increase using epoch based reclamation. I profiled the program and traced the context switches back to some mutexes in jemalloc.
Stat process with time
I was trying to measure the memory usage peak of different memory reclamation approaches NIL(no reclamation), HPBP(Hazard pointer based), and EBR(epoch based). I used time to read system counters and get the memory consumption.
LD_PRELOAD=/usr/lib/libjemalloc.so /usr/bin/time -v ./bin/main <args>
Note that Interval-Based-Reclamation does not use any memory pools or arenas, so it is required to use jemalloc to reduce page faults.
/usr/bin/time shows context switch information aside from memory's maximal resident size. They are all recorded in the following table.
| ops/sec | Memory Peak(KB) | Minor (reclaiming a frame) page faults | Voluntary context switches | Involuntary context switches | |
|---|---|---|---|---|---|
| NIL | 31,118,761 | 10,660,544 | 238,047 | 2,997 | 3,284 |
| HPBR | 7,091,661 | 554,064 | 76,372 | 1,035 | 3,186 |
| EBR | 26,629,611 | 782,760 | 243,314 | 211,896 | 3,169 |
| EBR reclamation has far more voluntary context switches than no reclamation(100x) and HPBR(200x). |
Source of voluntary context switches
Voluntary context switches includes cases such as the process is waiting for an I/O operator to complete, the process triggers an fault, etc.
In running Interval-Based-Reclamation, each thread is pinned 1:1 onto cpu cores wth no I/O operations. Faults (e.g. page faults) are almost eliminated by using jemalloc as well. Therefore, I suppose that these voluntary context switches are very likely coming from some syscalls.
Count system calls with perf
In order to confirm the hypothesis that the EBR reclamation implementation somehow triggers a lot of syscalls, use perf to count all the system calls.
perf stat -e 'syscalls:sys_enter_*' -p $PID
Result shows that futex has been continuously called. 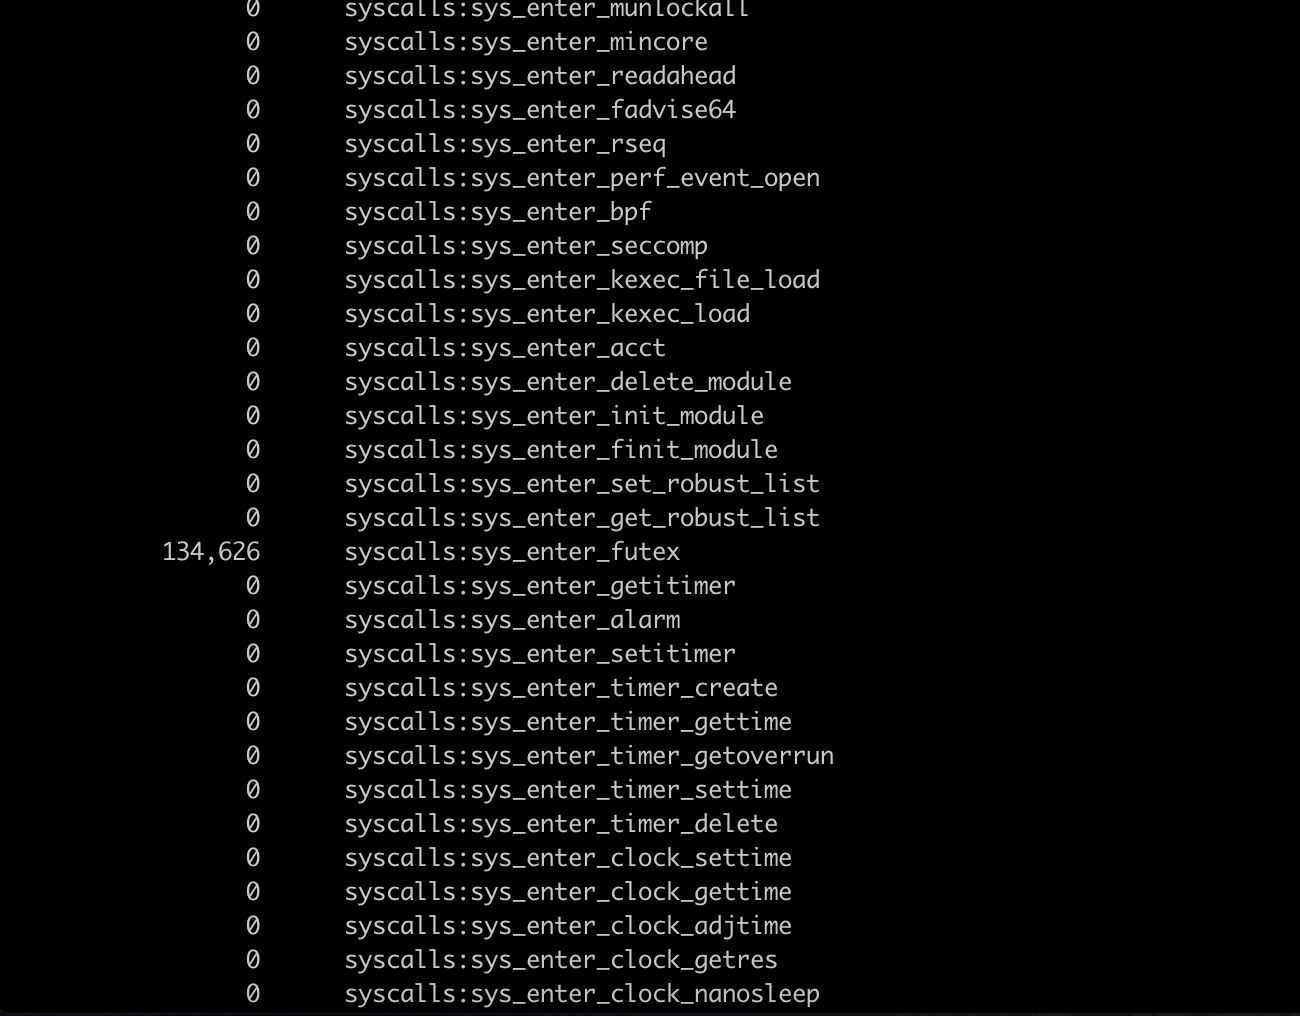
Trace system calls
strace can be used to show system calls as well.
strace --trace=futex -p $PID
From the trace, futex is called from different PCs. 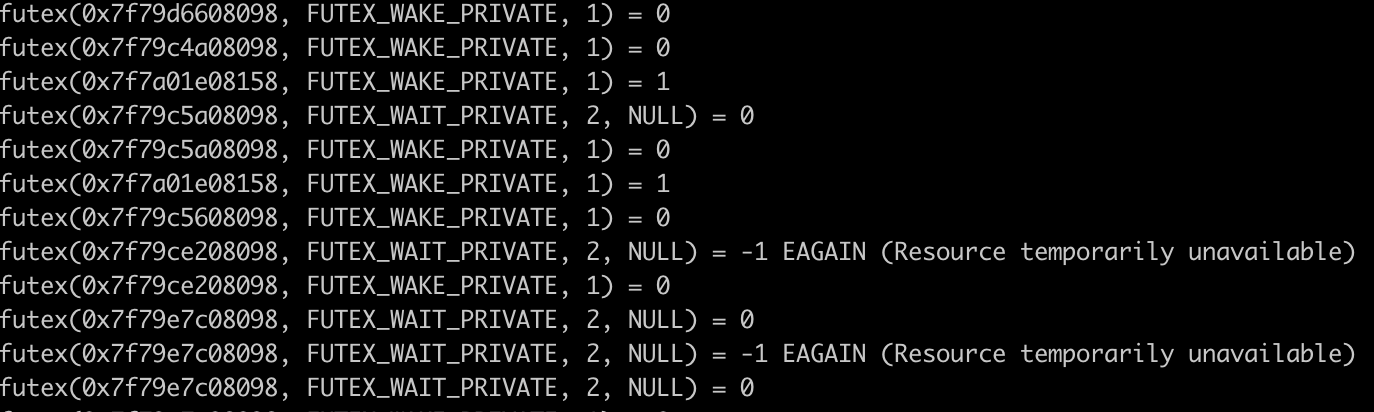
Stacktrace the system call with gdb
To identify the PC of futex, use gdb to set a breakpoint on the futex syscall.
(gdb) catch syscall futex
One of the stack traces: 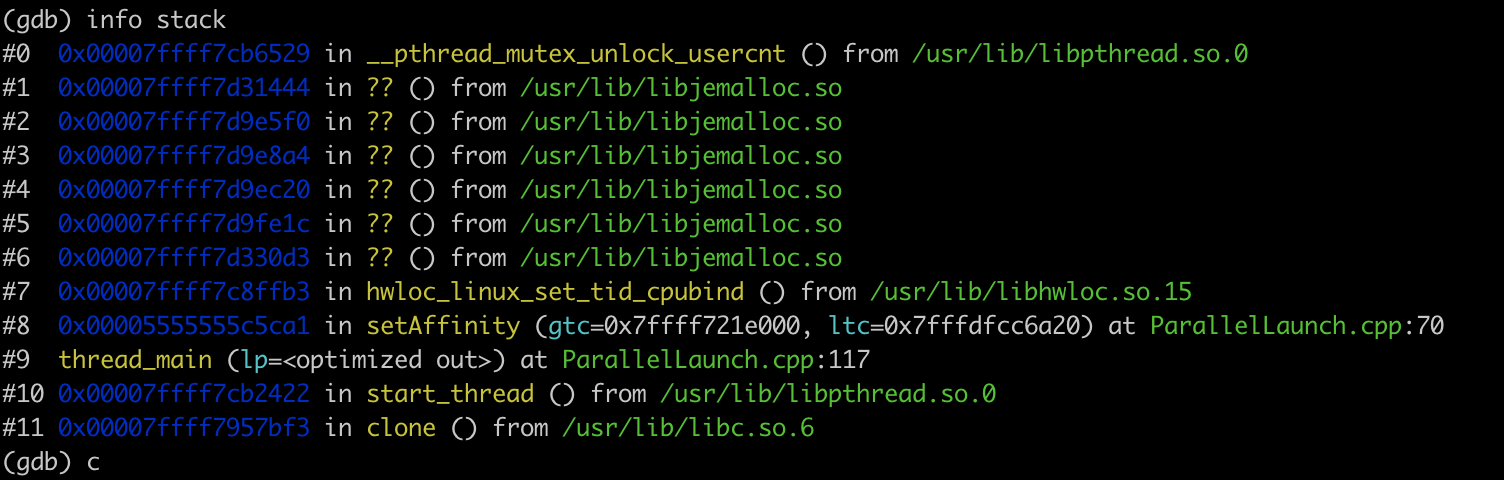
Summary
The observed voluntary context switches are coming from mutexes inside jemalloc. However, why and how it happens is still unknown, which may require a deeper understanding of the implementation of jemalloc and is out of the scope of this post.